
HydroBench - Introduction
Contents
HydroBench - Introduction

![]()
![]()
Hydrological Model Benchmarking and Diagnostics
Hydrological model performances are commonly evaluated based on different statistical metrics e.g., the Nash Sutcliffe coefficient (NSE). However, these metrics do not reveal neither the hydrological consistency of the model nor the model’s functional performances, such as how different flux and store variables interact within the model. As such, they are poor in model diagnostics and fail to indicate whether the model is right for the right reason. In contrast, hydrological process signatures and information theoretic metrics are capable of revealing the hydrological consistency of the model prediction and model internal functions respectively. In addressing this gap, HydroBench provides a comprehensive model benchmarking and diagnostic using:
a set of statistical predictive performance metrics: Nash Sutcliffe coefficient, Kling and Gupta coefficient, percent bias and pearson correlation coefficient
a set of hydrological process based signatures: flow duration curve (FDC), recession curve, time-linked flow duration curve (T-FDC), and runoff coefficient, and
information theoretic based metrics, particularly Transfer Entropy (TE) and Mutual Information(MI).
A detailed description of each set of benchmarking metrics is provided in the next sections.
Input and output of HydroBench
HydroBench accepts model and observed data in a predefined structure. The input structure is a table of data that consists of column heads and the corresponding DateTime. The minimum number of columns in the input table is two (e.g., observed streamflow, and model streamflow) with their start and end dates. With these three inputs, basic benchmarking results can be obtained. The basic results are all of the predictive performance metrics, FDC, and T-FDC. With an extended input table that contains one or more columns of independent predictor variables (e.g., precipitation), HydroBench can provide all of the three metrics - predictive, hydrological signature, and functional performance measures (Figure). Since HydroBench has a modular design, it can easily be called into any notebooks that host model results and generate a table of inputs (e.g., Figure a). Similarly, any single metric can be employed depending on users’ preferences.
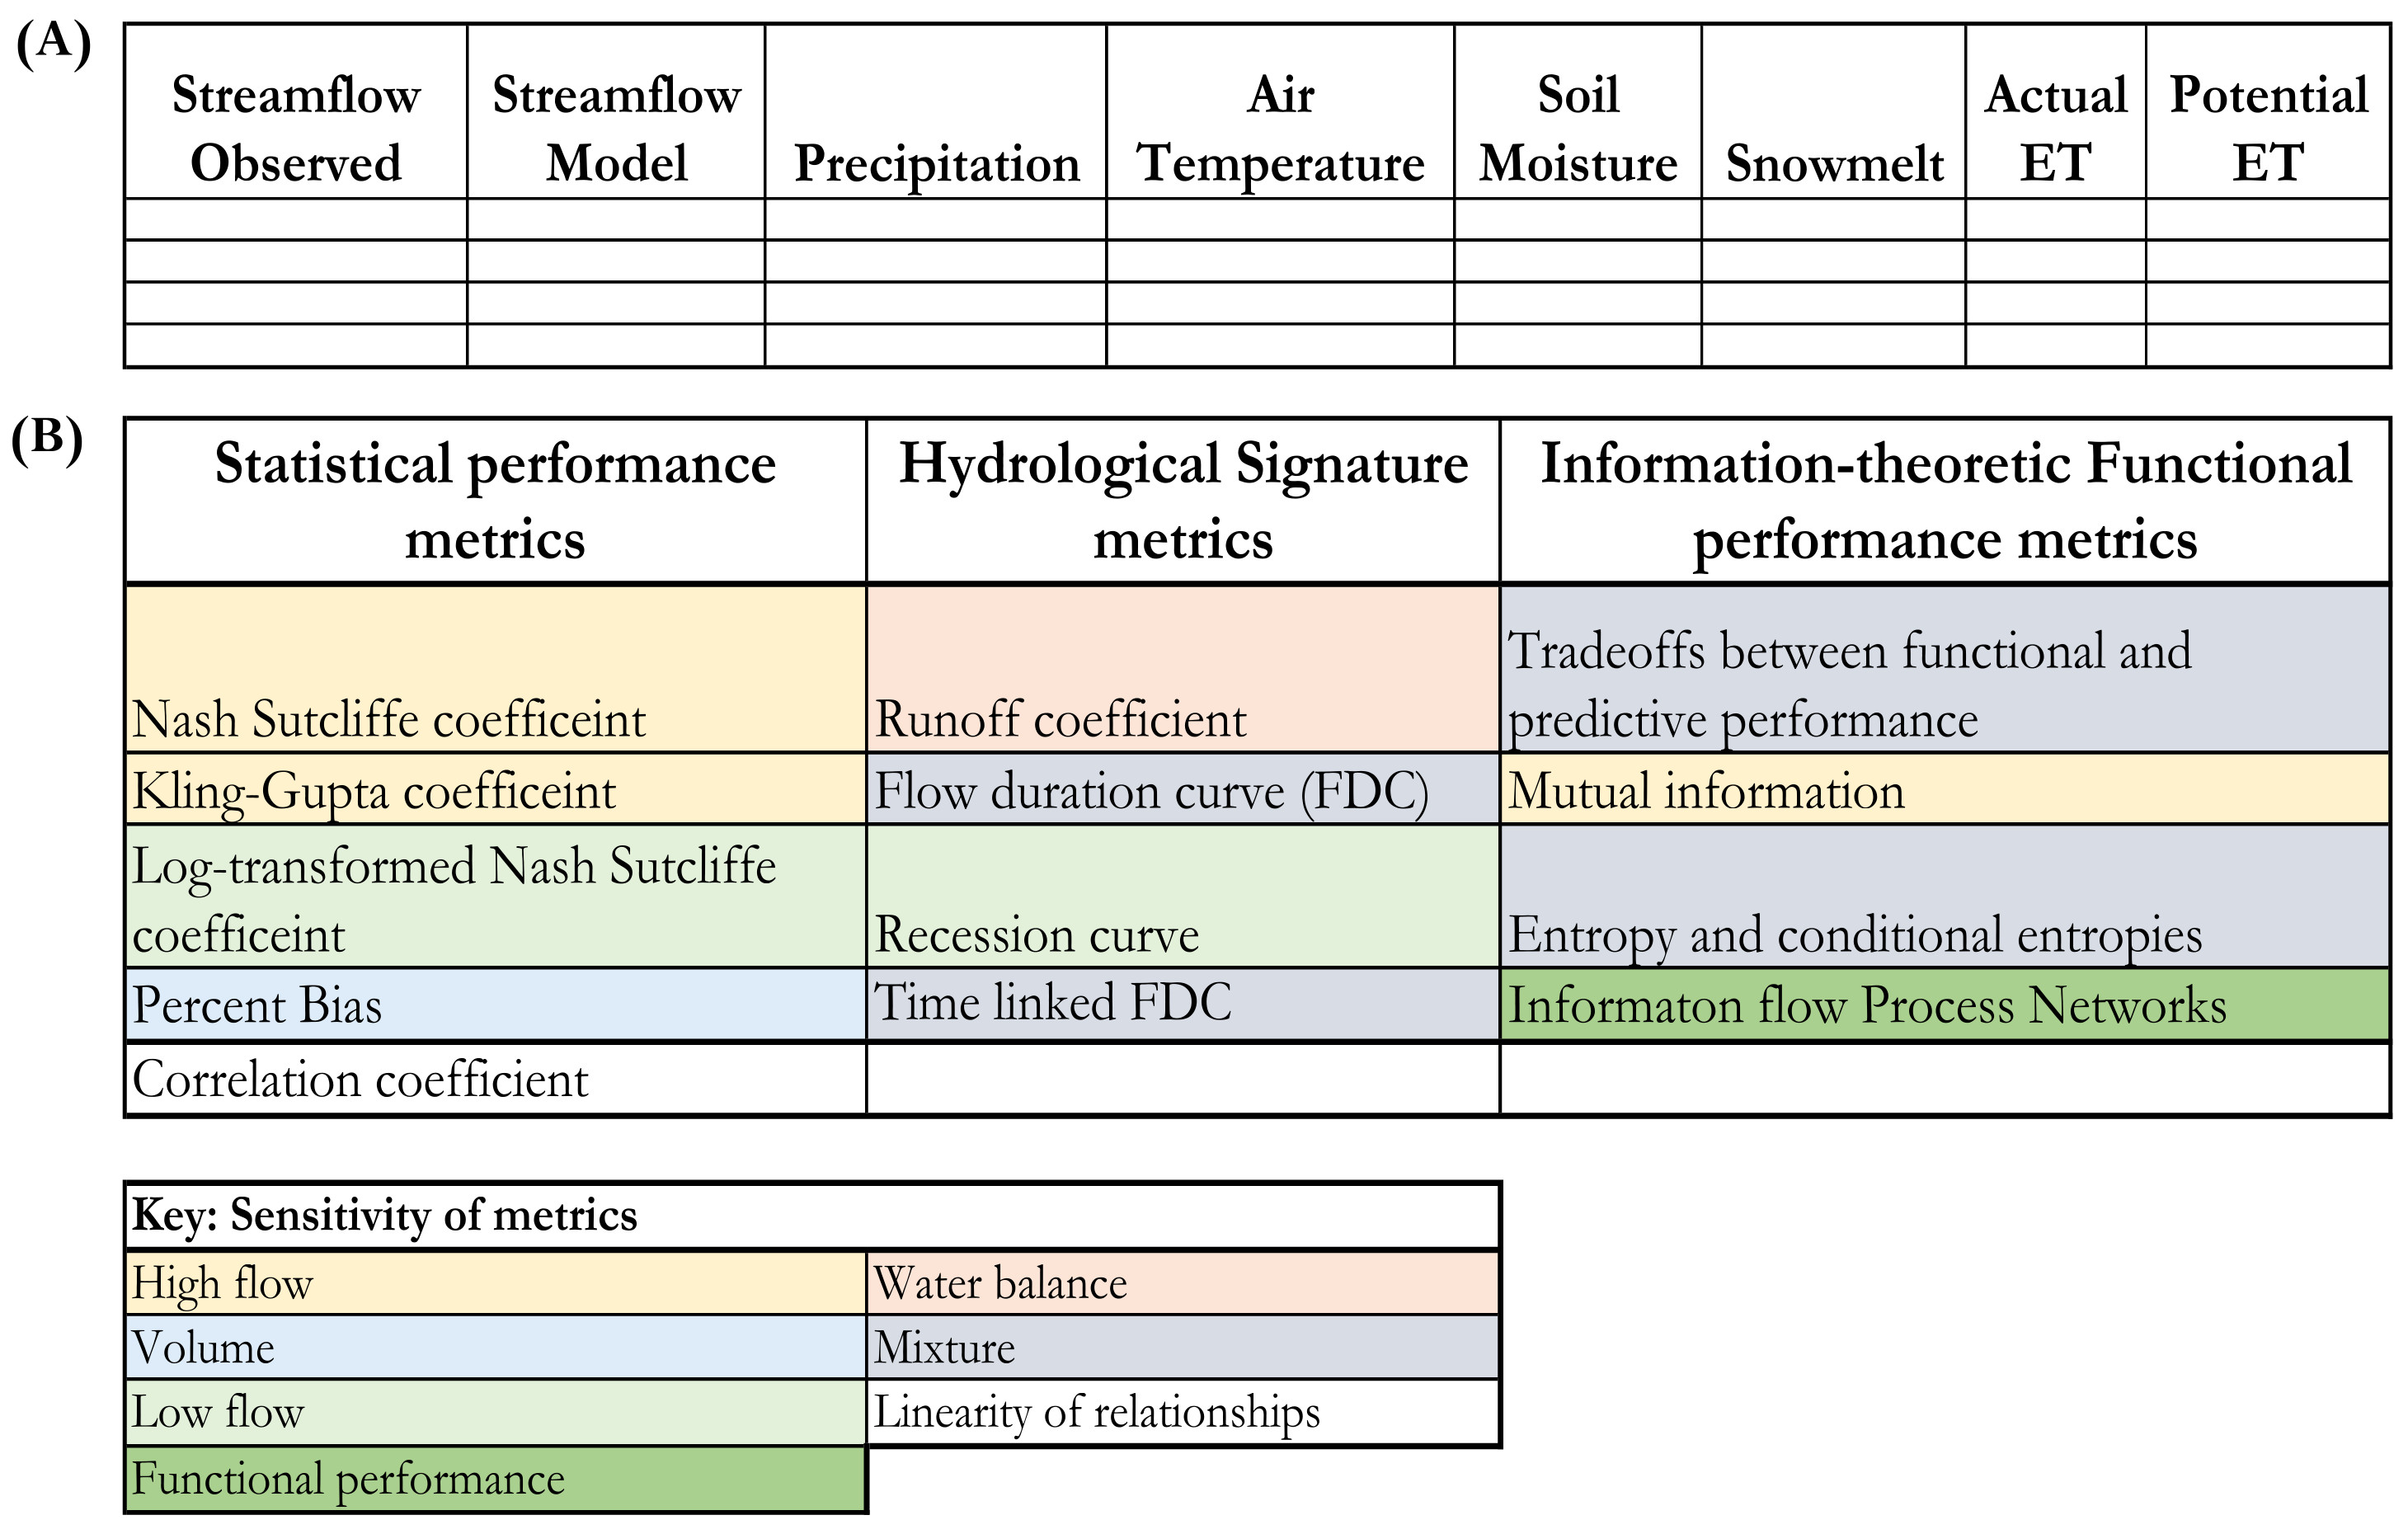
Figure: A) Example of standard input table to HydroBench, and B) Summary of the output metrics of HydroBench and their sensitivities (color-coded).
Application test case
The application of these metrics is demonstrated on the the National Hydrologic Model product using the PRMS model (NHM-PRMs). NHM-PRMS has two model products covering the CONUS - the calibrated and uncalibrated model products. Out of the CONUS wide NHM-PRMS products, the example notebook at the end of this Jupyterbook focuses on the NHM-PRMS product at the Cedar River, WA.
For an interactive use of the example notebook, please refer to the following binder link
![]() .
.